


Health care spending varies radically across the 50 states. Massachusetts (at $9,278 per person) spends 84% more that Utah ($5,031), for example.
Health care spending varies radically across the 50 states. Massachusetts (at $9,278 per person) spends 84% more that Utah ($5,031), for example.
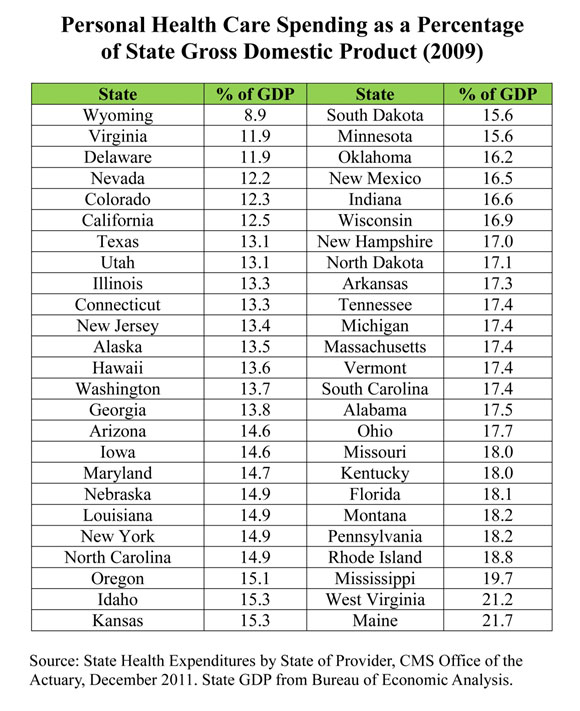
Another way to compare the states is the way international comparisons are usually made: How much does each state spend on health care as a percent of state income? For example, health care spending in three states — Maine, West Virginia and Mississippi — accounts for one out of every five dollars of state GDP. Conversely, Wyoming spends less than 9 percent. (See the table at the end of this post.) If every state were like Wyoming, the United States as a whole would be spending less of its income on health care than about three-fourths of the other developed countries.
One reason why this may be important is that under the Affordable Care Act reform basically takes place at the state level. Yet the states are clearly very different.
More Read


By conventional measures, the United States spends considerably more on health care than other countries (although these measures have been challenged). Many believe that the key to why the U.S. spends more lies in the way private sector medicine is practiced across the different states. Among the 50 states, however, a study by the National Center for Policy Analysis finds that the public sector exhibits much more variability from state to state than the private sector; public sector medicine, rather than private sector medicine, may be the culprit.
For example, over a 40-year period:
- The variation in Medicaid spending across the 50 states, as a percent of state domestic product, was from two to three times greater than the variation in private sector spending.
- The variation in Medicare spending was from one and a half to two times greater that the variation in private sector spending.
In general, private sector spending is much more similar from state to state than government spending. Overall:
- Medicare spending ranges from $11,903 per enrollee in New Jersey to $7,576 in Arizona.
- Medicaid spending ranges from $11,569 per enrollee in Alaska to $4,569 in California.
The two programs also operate very differently from state to state. For example:
- While 43 percent of beneficiaries are in Medicare Advantage plans (mainly managed care) in Minnesota, the figure is less than 10 percent in Alaska, Delaware, Vermont, Wyoming and New Hampshire.
- While South Carolina and Tennessee have 100 percent of their Medicaid enrollees in managed care programs, Alaska, New Hampshire and Wyoming have no Medicaid managed care enrollment.
The Limitations of Generalizing From Medicare Data
Another issue raised by the study is the tendency on the part of some policy analysts to generalize from Medicare data. Researchers at Dartmouth find widespread variation in per capita Medicare reimbursements across the country. Atul Gwande made a similar observation in a New Yorker article, comparing high Medicare spending in McAllen, Texas, with lower Medicare spending in El Paso. In both cases, commentators used these facts to infer that we could save an enormous amount of money if doctors in the high-spending areas practiced medicine the same way as doctors in the low-spending areas.
The NCPA study, however, suggests that different types of spending may substitute for each other. In states where there are more uninsured and therefore more unpaid bills, for example, Medicare spending per enrollee is higher. In some states where Medicare spending is high, private sector spending is low and vice versa. For example, Texas is fifth from the top in Medicare spending per enrollee, but the state is fourth from the bottom in per capita private health care spending. On the other hand, Wyoming is seventh from the bottom in Medicare spending per enrollee, but the state is twelfth from the top in per-capita private sector spending.
As for McAllen, Texas, part of the reason for its high Medicare spending is that it has almost four times the national average in “disproportionate share” spending (to compensate for a high volume of uninsured and Medicaid patients). In the private sector, McAllen actually spends less per person than El Paso does.
Challenging an Article of Faith
For some time, an article of faith among many health reformers has been the idea that we can substantially reduce health care spending by having providers in high-spending areas practice medicine the way it is practiced in low-spending areas. The evidence reviewed here suggests that if we want the high-spending states to emulate the low-spending states, the place to start is with the public sector, not the private sector.
But it’s more likely that the entire idea is misdirected. Another NCPA study found that 80 percent of the variation in Medicare spending per enrollee could be explained by demographics (age, race, sex, etc.), income, and the uninsured rate. After making adjustments for these variables, the study asked how much money Medicare could save if every state matched the performance of the five lowest-spending states? The answer: about 10 percent. For all health care spending, how much could be saved if every state matched the performance of the five lowest-spending states? Answer: about 5 percent.
And remember, you don’t even get the 5 percent unless you copy perfectly.
This finding is consistent with other research. A new paper by Louise Sheiner, an economist at the Board of Governors of the Federal Reserve System, concludes that health and socioeconomic factors — e.g., the prevalence of smoking, obesity and diabetes — best explain why health spending in some regions of the country is higher. This is also the view of Richard “Buz” Cooper of the University of Pennsylvania.

A version of this Health Alert (co-authored with Tom Saving) appeared at the Health Affairs Blog.


