By using this site, you agree to the Privacy Policy and Terms of Use.
Accept
Health Works CollectiveHealth Works CollectiveHealth Works Collective
  • Health
    • Mental Health
  • Policy and Law
    • Global Healthcare
    • Medical Ethics
  • Medical Innovations
  • News
  • Wellness
  • Tech
Search
© 2023 HealthWorks Collective. All Rights Reserved.
Reading: Another Reason Why Accurate Comparison of Health System Costs in Different Countries Is Difficult
Share
Notification Show More
Font ResizerAa
Health Works CollectiveHealth Works Collective
Font ResizerAa
Search
Follow US
  • About
  • Contact
  • Privacy
© 2023 HealthWorks Collective. All Rights Reserved.
Health Works Collective > Business > Finance > Another Reason Why Accurate Comparison of Health System Costs in Different Countries Is Difficult
BusinessFinanceGlobal Healthcare

Another Reason Why Accurate Comparison of Health System Costs in Different Countries Is Difficult

JohnCGoodman
JohnCGoodman
Share
3 Min Read
1
SHARE

In order to compare health costs in different countries, expenditures must be converted into a common currency. In practice, this is a more difficult problem than many people think.

1

In order to compare health costs in different countries, expenditures must be converted into a common currency. In practice, this is a more difficult problem than many people think.

1

More Read

healthcare-acquired infection
Imposing Order on a Microbial World
Initiating a Bundled Payment Project
Medicare? I’m Sorry, the Doctor Won’t See You Now
20 Rules to Kick-Start Successful Email Marketing
Telemedicine: Endless Possibilities for Hospital Marketers

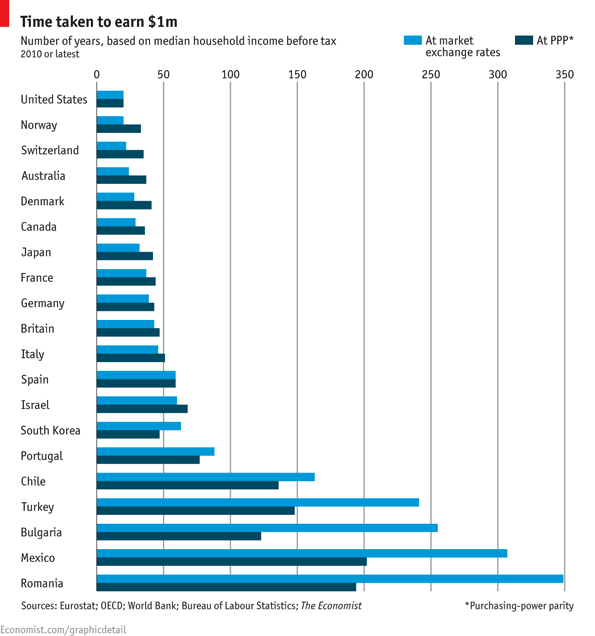
Here’s a graph from The Economist showing how the choice of exchange rate comparison can alter conclusions. The light blue line compares incomes in various countries using market exchange rates. The dark blue line compares incomes using purchasing power parity.

Market exchange rates are the price of one currency in terms of another when currencies are bought and sold on international markets. The demand and supply of international currencies is driven by the markets for internationally traded goods and by capital flows between countries.


But many of the goods and services that people consume never cross an international boundary. Purchasing power parity begins with the notion that in the long run exchange rates should adjust to equalize the price of the same basket of goods and services whether it is sold in Rome, Nairobi, or Tokyo. Define the basket of goods, price it in different countries, calculate the exchange rate that equalizes the prices, and use that exchange rate to compare costs across countries.

One of the more famous purchasing power parity indices is The Economist magazine’s Big Mac Index. The Big Mac is the only content of this goods and services basket (in India, where Big Macs are not sold, the chicken Maharaja Mac is substituted). In this 2012 post, the average Big Mac price in America was $4.20. The average Big Mac price in Switzerland was $6.81. Calculating Swiss franc/U.S. dollar rate that would equalize Big Mac prices leads to the conclusion that the franc to U.S. dollar market exchange rate is 62% higher than it should be. An up to date interactive Big Mac Index is here.

Most international health system cost comparisons use purchasing power parity. But the baskets of goods and services that they are based on vary. The Manhattan Institute has a chart from Chris Conover that compares the results for U.S. health care spending with the rest of the OECD using the GDP purchasing power parity used by the OECD with a different basket of goods that he terms health purchasing power parity.

2

3


TAGGED:healthcare costs
Share This Article
Facebook Copy Link Print
Share

Stay Connected

1.5kFollowersLike
4.5kFollowersFollow
2.8kFollowersPin
136kSubscribersSubscribe

Latest News

post-surgical recovery
Your Guide To Key Milestones In At Home Post-Surgical Recovery
Health Infographics
December 14, 2025
Dehydration Poses Serious Risks For Older Adults
Why Dehydration Poses Serious Risks For Older Adults
Infographics Senior Care
December 14, 2025
care settings
Hidden Risks In Care Settings: Who Faces The Greatest Threat From Healthcare-Associated Infections
Global Healthcare Health care Infographics
December 14, 2025
Medical Appointment
From Scheduling To Follow-Up: The Full Lifecycle Of A Medical Appointment
Infographics Medical Education Policy & Law
December 14, 2025

You Might also Like

Telemedicine Image Collaboration Enhances Patient Safety

March 30, 2013

Patient-Centric Care at the Hub of Telehealth

May 10, 2011
healthcare price transparency
BusinessFinanceHospital Administration

Price Transparency: The Devil is in the Detail for Hospitals

October 17, 2014

Taking Patient Engagement Into the Shark Tank

April 8, 2015
Subscribe
Subscribe to our newsletter to get our newest articles instantly!
Follow US
© 2008-2025 HealthWorks Collective. All Rights Reserved.
  • About
  • Contact
  • Privacy
Welcome Back!

Sign in to your account

Username or Email Address
Password

Lost your password?