
Summary: Massachusetts is live with its effort to reveal health care prices. As of Oct. 1, insurance companies were bound to reveal what insured people will pay for procedures, and so far the results of those revelations are not clear.
This is important not just because health cost transparency is one of our favorite issues; it’s also important because knowing what things cost is a factor in how people choose treatment and what they pay for their health insurance and for their treatments.

Our friend Martha Bebinger took some of the transparency calculators for a test drive and wrote about them for WBUR in Boston. She’s a great reporter, and she noticed some strengths and some weaknesses. Here’s her post.
For now, we don’t have access to these calculators, so we’ll report some of Bebinger’s observations:
“1.) Prices are not standard, they vary from one insurer to the next. I shopped for a bone density test. The low price was $16 at Tufts Health Plan, $87 on the Harvard-Pilgrim Health Care site and $190 at Blue Cross Blue Shield of Massachusetts. Why? Insurers negotiate their own rates with physicians and hospitals. And some of the prices include all charges related to your test, others don’t (see No. 2).
“2.) Posted prices may or may not include all charges, for example the cost of reading a test or a facility fee. Each insurer is defining ‘price’ as they see fit. Read the fine print.
“3.) Prices seem to change frequently. The first time I shopped for a bone density test at Blue Cross, the low price was $120. Five days later it had gone up to $190.
“4.) There is no standard list of priced tests and procedures. I found the price of an MRI for the upper back through Harvard Pilgrim’s Now iKnow tool. That test is ‘not found’ through the Blue Cross ‘Find a Doc’ tool.”
Among the big drawbacks of this approach: If I lived in Massachusetts, it seems, I could use only my insurance company’s calculator. So would I be able to compare as Bebinger has? That seems crucial as people look to choosing their insurance plans.
High underlying costs, high premiums
It’s also true that the underlying costs of items and procedures in health care are a primary source of rising insurance premiums.
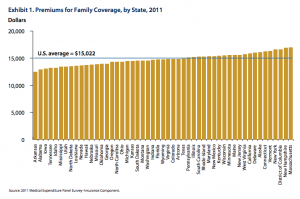
Massachusetts has the highest health insurance premiums in the nation for private, employer-sponsored health plans, as shown in the chart above, from this Commonwealth Fund study.
Why? Health care costs a lot. There are a lot of high-priced providers in Massachusetts. Also, the state has consistently ranked among the states with a high per-capita income. Don’t forget, the state has one of the highest percentages of insured people, having adopted Romneycare well before the rest of the nation was affected by the Affordable Care Act.
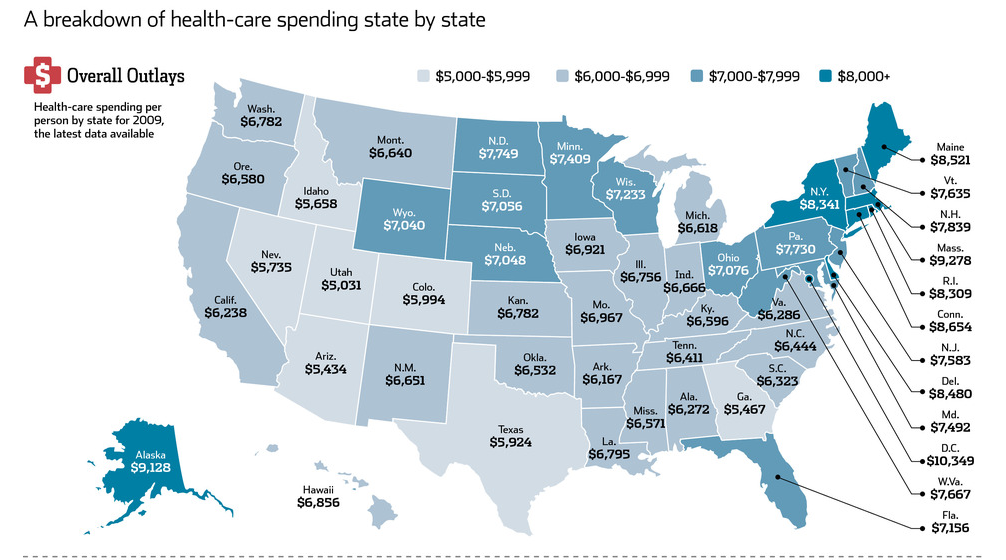
Massachusetts also has the highest annual per-capita health care spending in the nation, shown in the chart below, from The Wall Street Journal, based on federal statistics.
Other states have variations on transparency tools: you can find many of them on our “Useful Links” page, listed state by state. I love this Texas one, personally: it doesn’t restrict your search by insurer, but gives a statewide view of prices.


